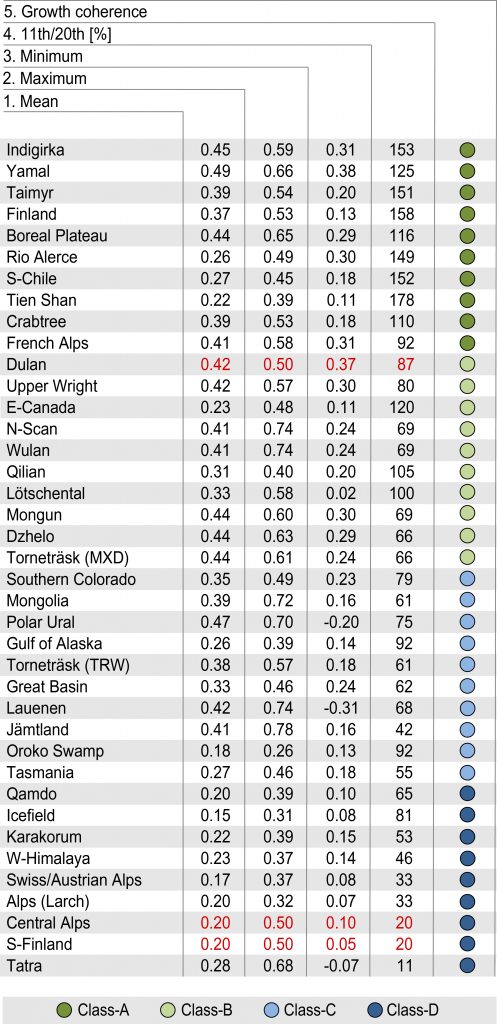
Table 4: Growth Coherence scores. Mean, maximum, and minimum correlations among the TRW(or MXD) series included in the reconstructions. 11th/20th is the ratio of the correlation during the 11th century relative to the 20th century correlation. Values in red are estimates.